
With three Key Messages:
- Globalization For All
- Closed For Businesses
- Harvest That Low Hanging Fruit
World Economic Forum’s 2016 edition of the Global Enabling Trade Report, has been released recently in conjunction with the Global Alliance for Trade Facilitation – a new public-private partnership to support trade-led development.
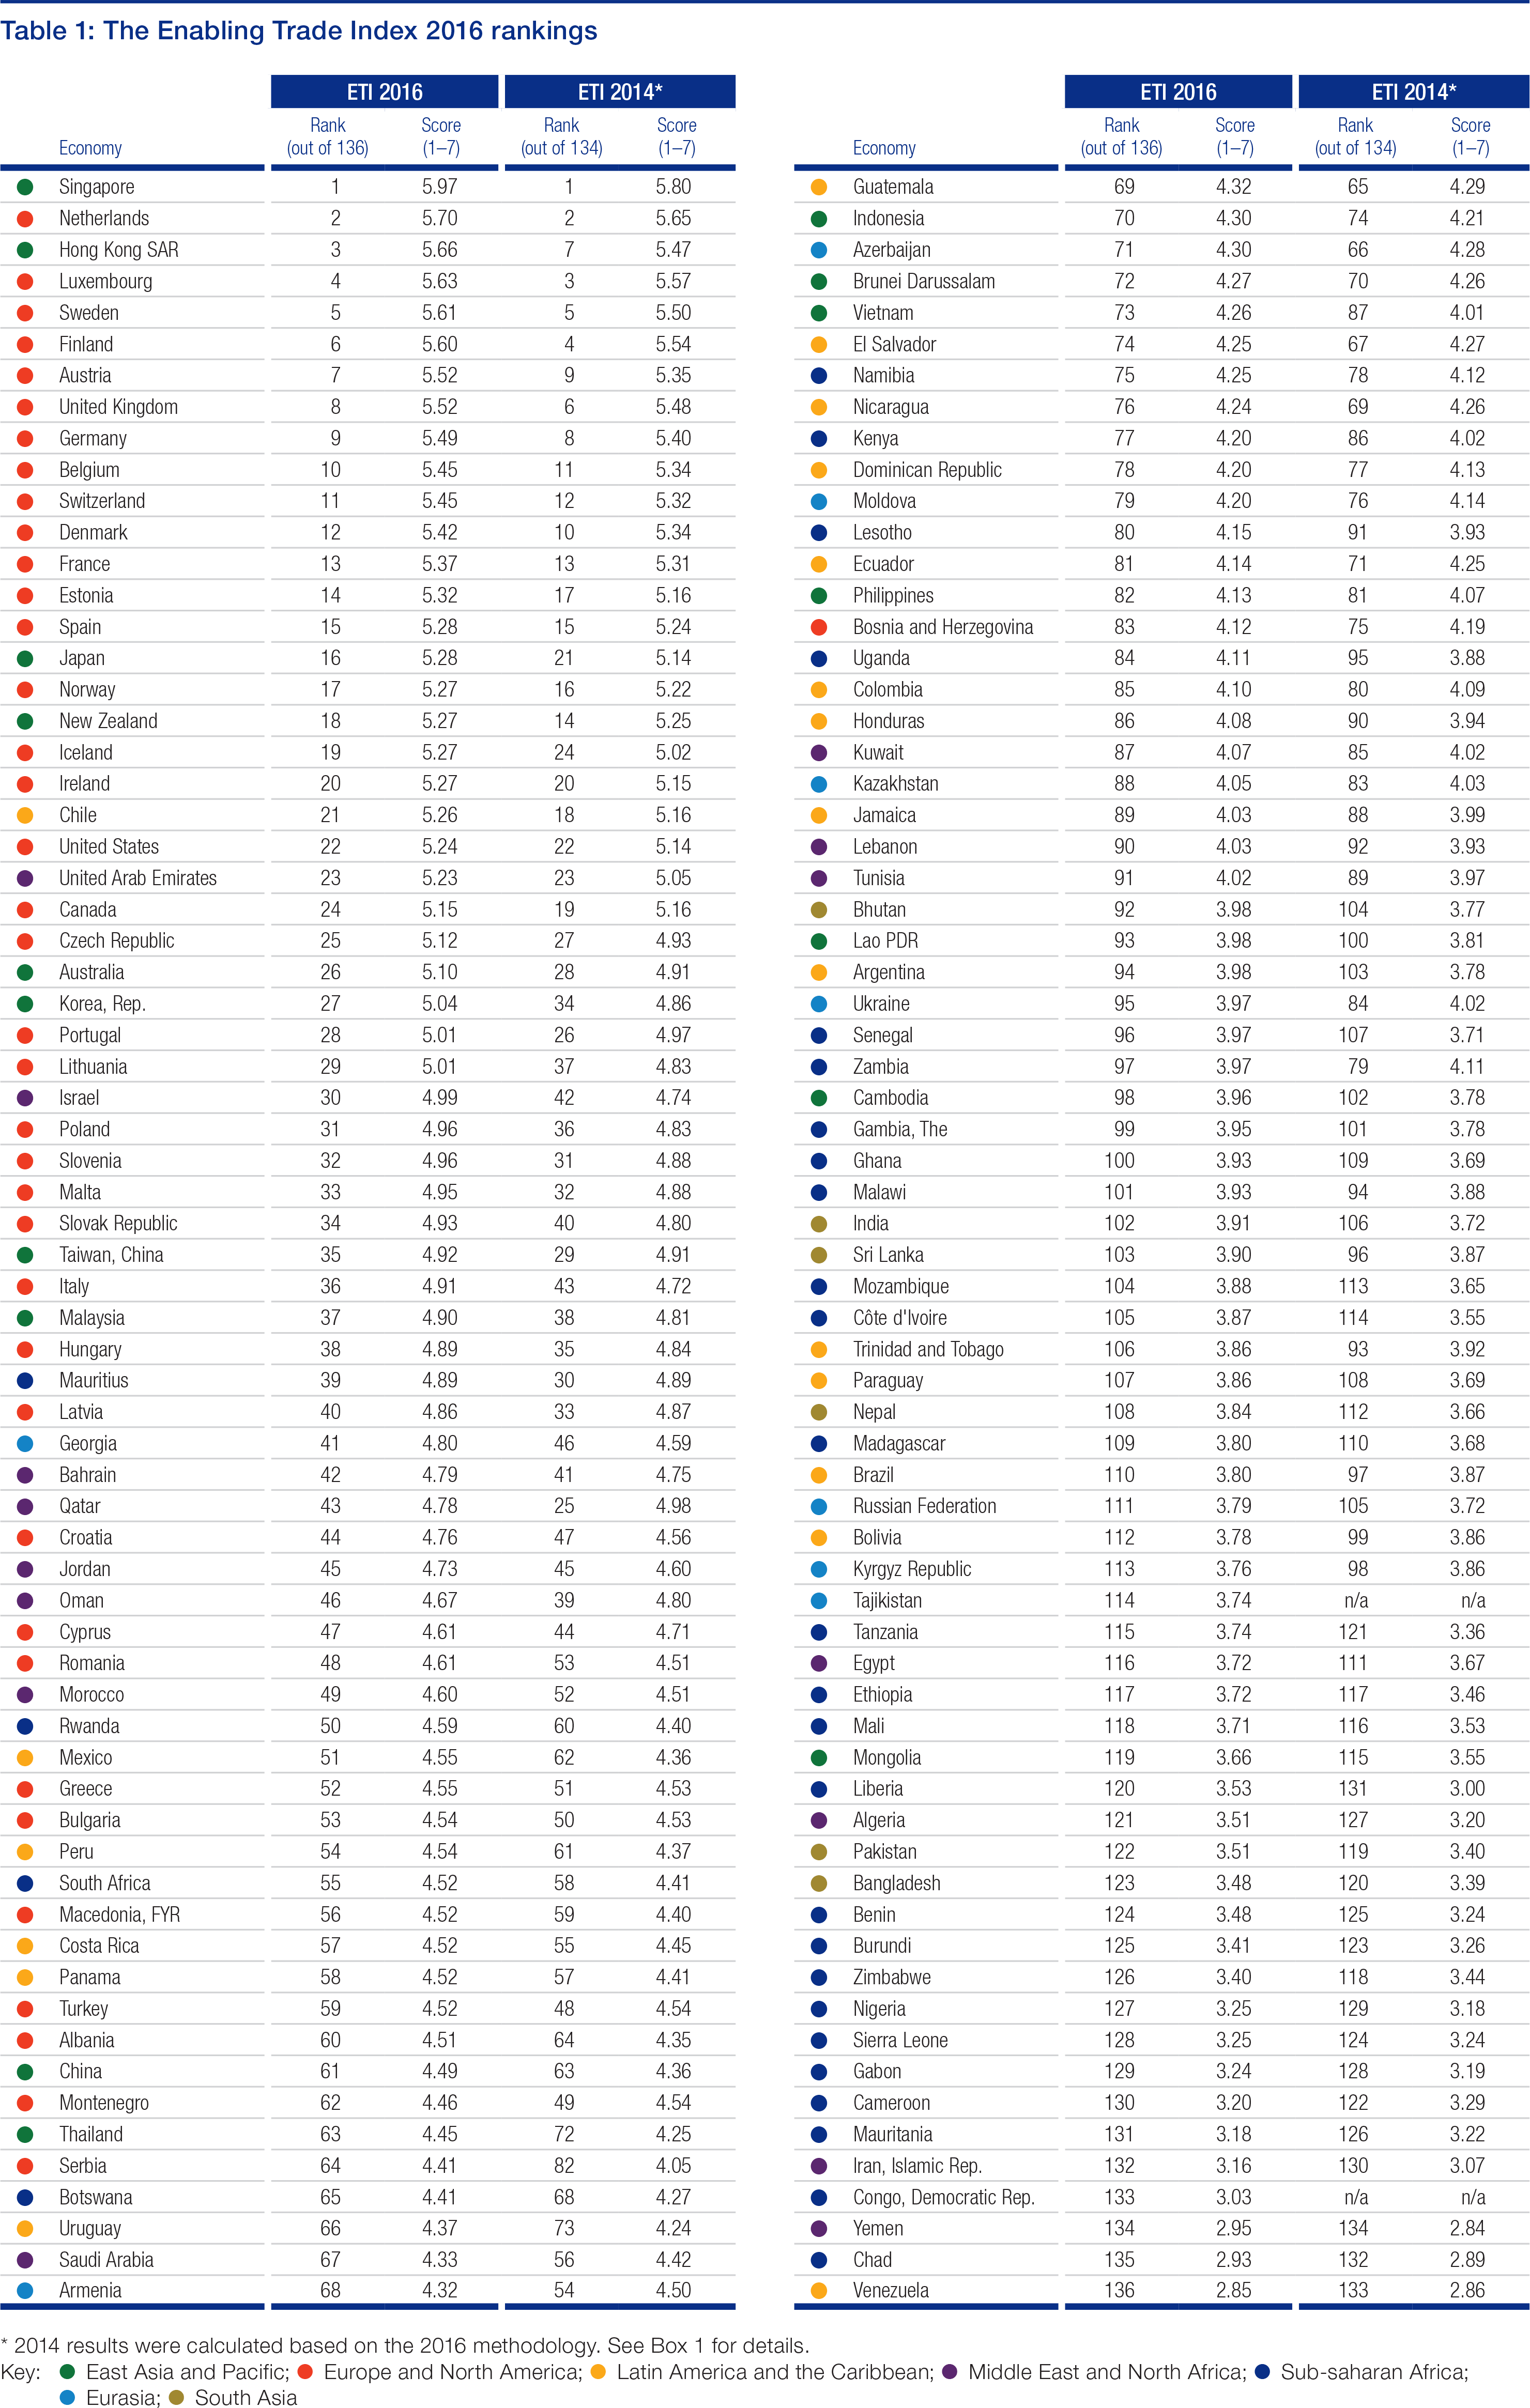
The Report features the Enabling Trade Index (ETI), which evaluates 136 economies based on their capacity to facilitate the flow of goods over borders and to their destination.
Singapore topped the ranking for the 5th time in a row and was in the top 3 for 5 of the 7 pillars. Venezuela stood at the bottom of the list.
According to the WEF, the two main findings from this edition of the index were (1) a large part of the world is still excluded from globalization, and (2) some of the world’s largest economies offer limited market access. Another major finding is that the ASEAN market has become more accessible than European Union (EU) and the United States markets.
THE ETI FRAMEWORK
Produced every two years, the Enabling Trade Index is a benchmark for governments looking to boost growth and development through trade. The report captures the efficiency, transparency and expense associated with importing and exporting goods. In doing so, the report looks at the quality of key customs services, such as the cost and number of documents to import and export goods as well as the time predictability and transparency of procedures.
The scope of the ETI is therefore much broader than trade facilitation as approached by most international organizations. Though not the sole object of the ETI, border administration features prominently in the ETI.
As a composite indicator, the ETI is composed of four main components, the subindexes:
A. Market access
B. Border administration
C. Infrastructure
D. Operating environment
The subindexes are subdivided into seven ‘pillars’:
1. Domestic market access
2. Foreign market access
3. Efficiency and transparency of border administration
4. Availability and quality of transport infrastructure
5. Availability and quality of transport services
6. Availability and use of ICTs
7. Operating environment
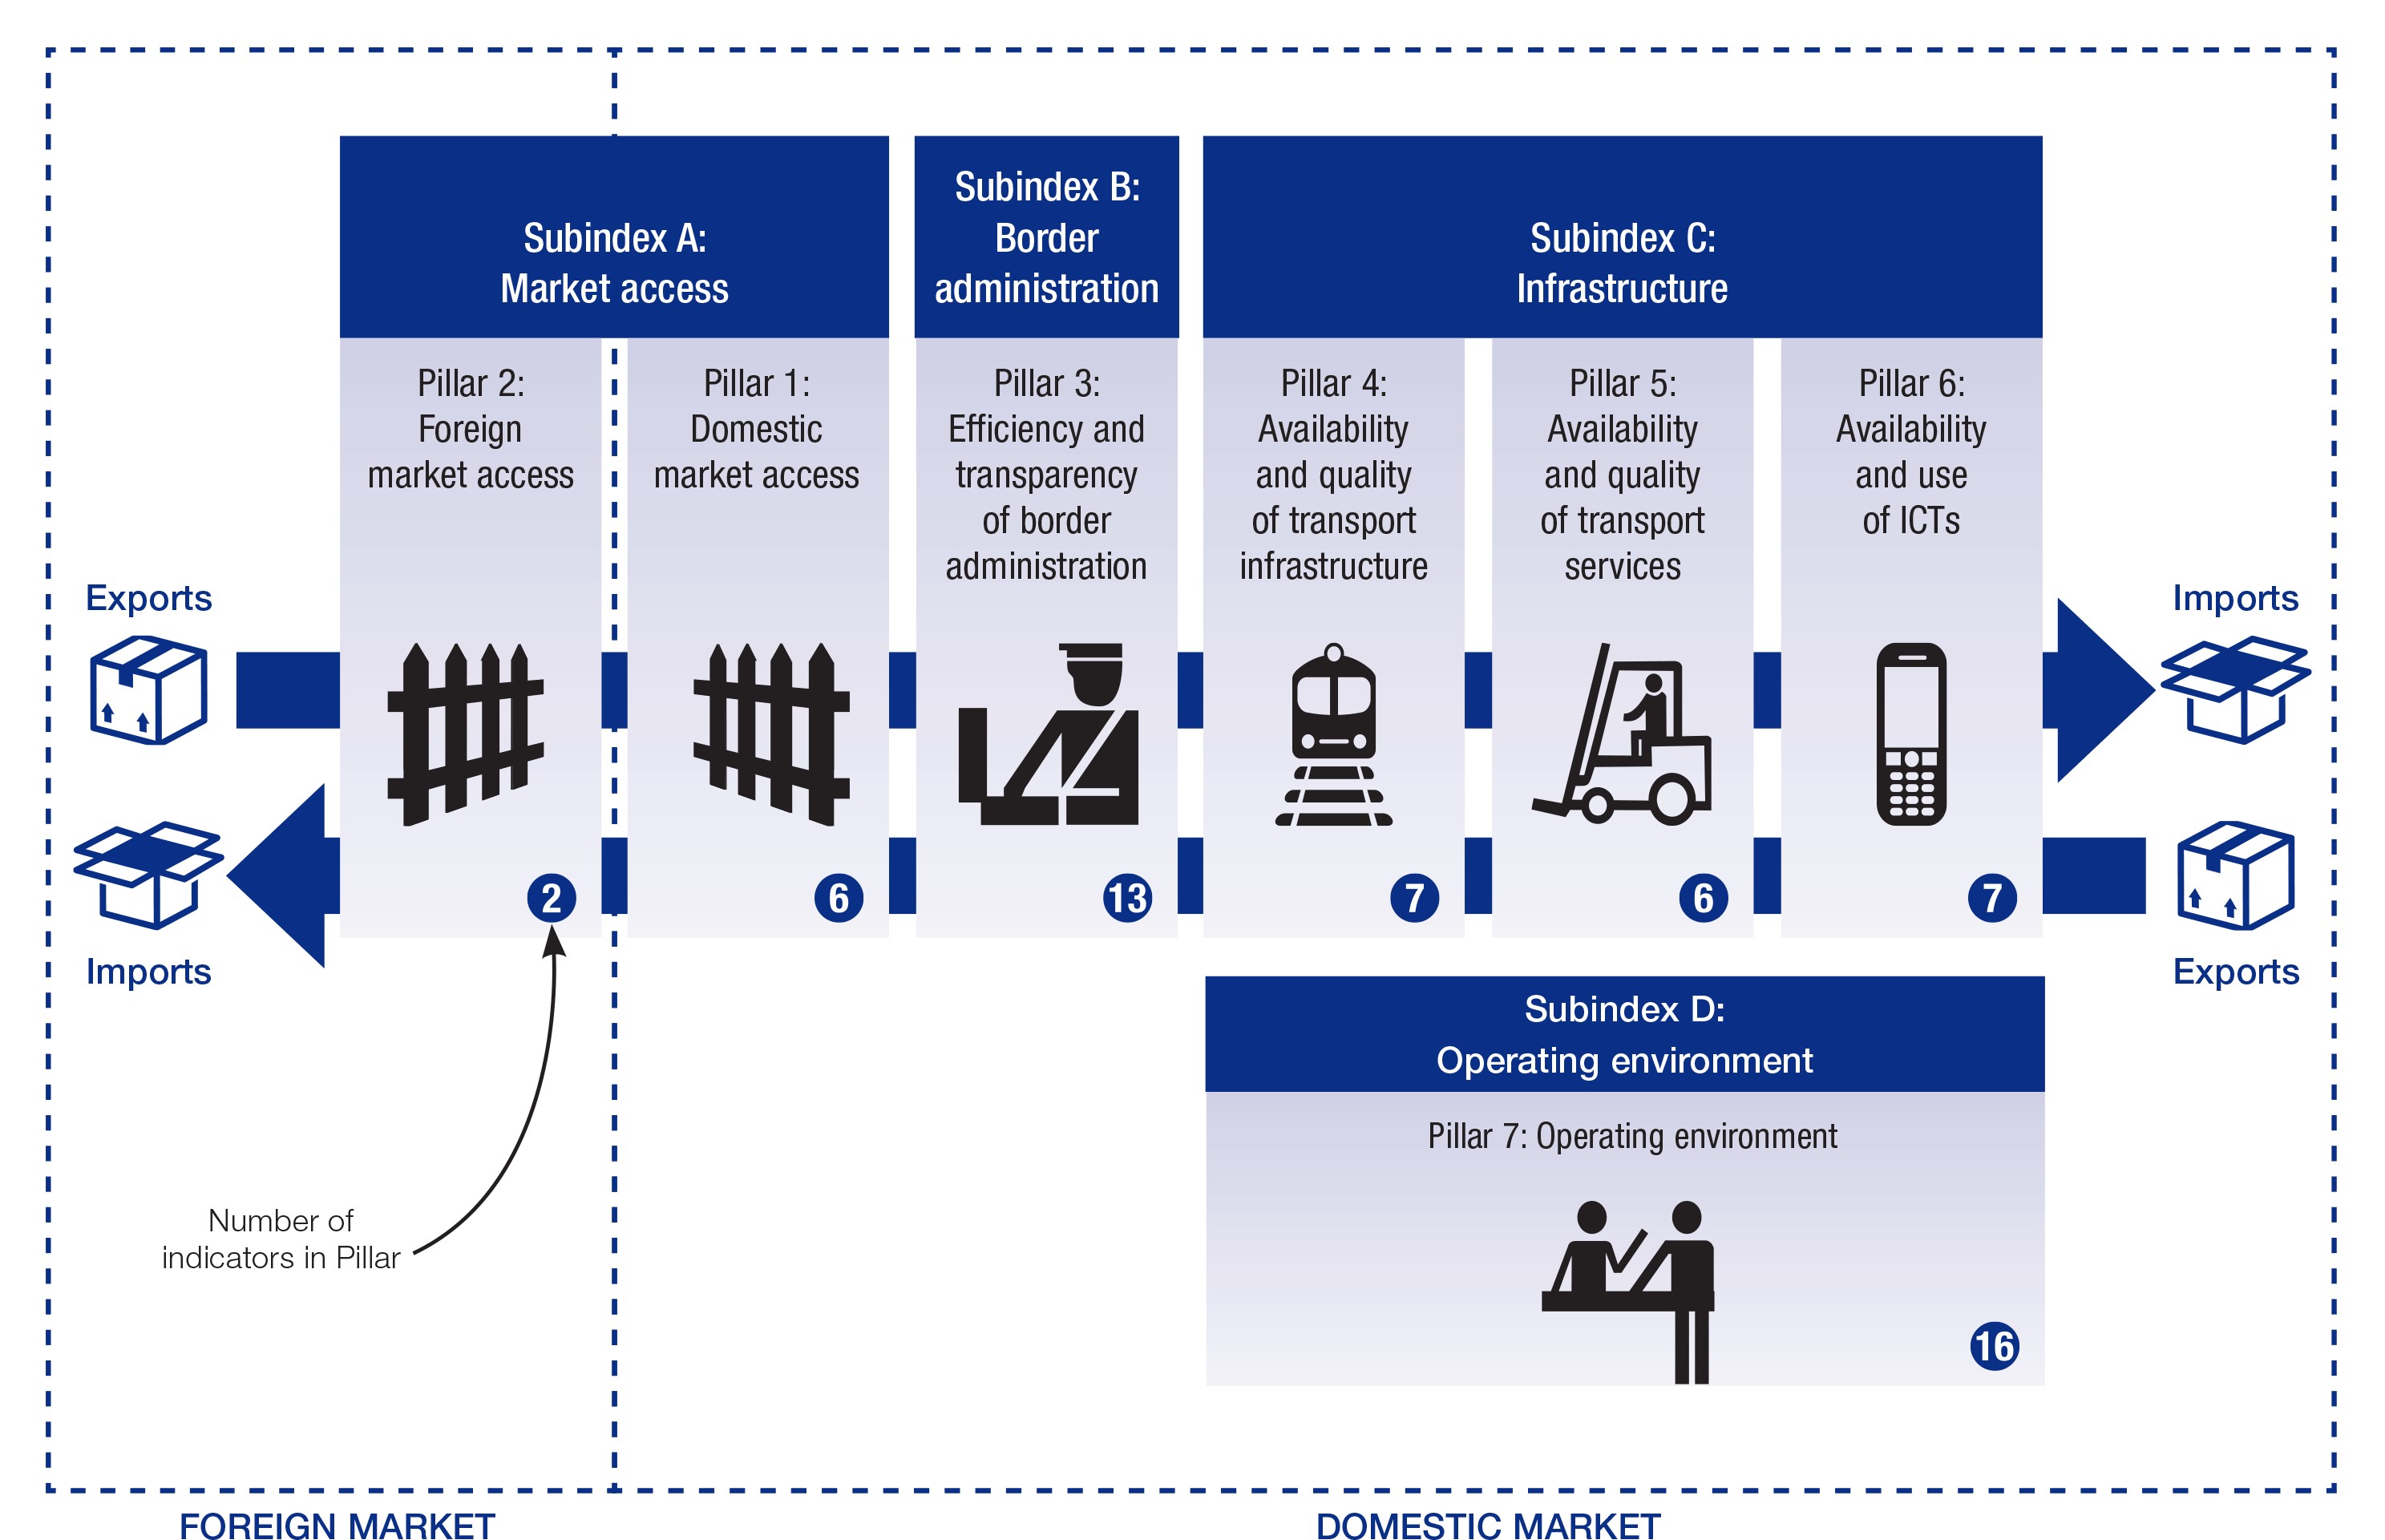
Global Enabling Trade Index Framework
Each pillar is composed of a total of 57 indicators and subindicators. Indicators and subindicators are drawn from various sources, measuring various trade-enabling factors.
The economy profiles, thus built, present the detailed performance in the ETI as well as additional information and data to enhance the analysis: economic and trade indicators, a unique dataset on the most problematic factors for exporting and importing, and a dashboard combining the OECD Trade Facilitation Indicators and the current status of the World Trade Organization’s Trade Facilitation Agreement (TFA) ratification and notifications.
PAKISTAN: ECONOMY PROFILE
The trade enabling index ranks Pakistan at 122 among the 136 countries being evaluated. The extremely insightful report reflects upon the number of challenges in Pakistan’s economy which affect the country’s performance on the ETI, and consequently are a measure of its economy.
The Key Indicators for Pakistan’s economy profile have been sourced from: International Monetary Fund; World Economic Outlook Database (April 2016); World Trade Organization, Merchandise Trade Statistics.
Population millions 186.2
GDP US$ billions 270.0
GDP per capita US$ 1450.0
Trade openness % GDP 24.5
Share of world trade % world total 0.20
Merchandise trade balance US$ billions -22.03
At the ETI, Pakistan scores a 3.5 on the bar of 1-7(best), where the min. score has been 2.85 (Venezuela), and max. score has been 5.97 (Singapore). The trend of growth has been a gradual upward lift.
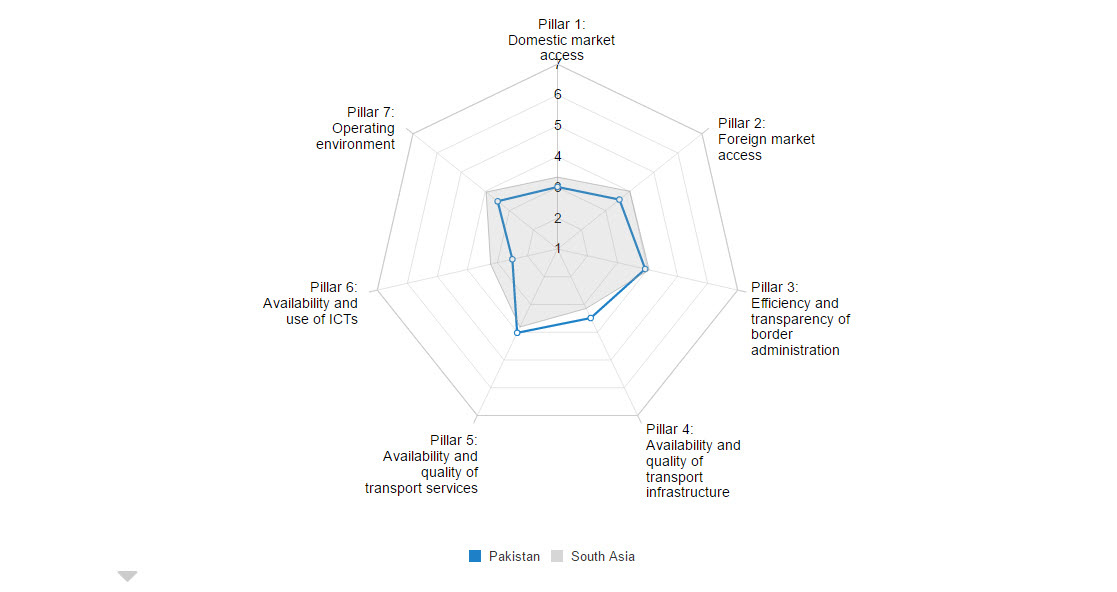
A subindex wise breakdown of Pakistan’s economy profile at the ETI yields the following results:
A. Market Access
Pakistan has scored 3.3 at the subindex Market Access of the ETI. The maximum score at the subindex is 5.86, and the minimum is 2.08.

B. Border Administration
Pakistan has scored 3.9 at the subindex Border Administration of the ETI. The maximum score at the subindex is 6.40, and the minimum is 1.70.
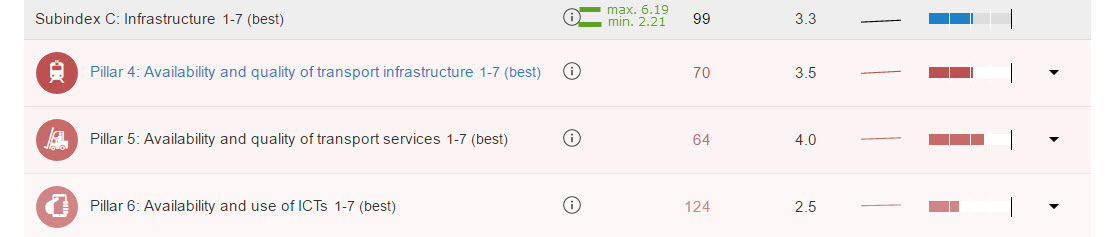
 C. Infrastructure
Pakistan has scored 3.3 at the subindex Infrastructure of the ETI. The maximum score at the subindex is 6.19, and the minimum is 2.21.
D. Operating Environment
Pakistan has scored 3.5 at the subindex Operating Environment of the ETI. The maximum score at the subindex is 5.86, and the minimum is 2.83.

As can be seen, despite the challenging environment, Pakistan continues to offer relatively efficient border administration systems for enabling trade with Pakistan.
Among other things, Pakistan’s performance on the four sub-indices is reflective of its integration into the global trade. The country’s latest economy profile at the global trade index has shown no trend of change in its operating environment and border administration against the 2014’s scores, whereas there’s a visible progression in its market access and infrastructure.
The Report gives Pakistan’s 3 top most problematic factors for importing as:
- Tariffs and non-tariff barriers
- 2. Burdensome import procedures
- Corruption at the border
Pakistan’s 3 top most problematic factors for exporting are given as:
- Access to trade finance
- Identifying potential markets and buyers
- Inappropriate production technology and skills
The 3 top most OECD Trade Facilitation Indicators for Pakistani economy as revealed by the Global economy Trade Index, are:
- Information availability
- Involvement of trade community
- Advance rulings
At the OECD trade facilitation scorecard of 0-2 (best,) Pakistan has scored an impressive 1.70 for Information Availability which has been a sum up of: publications, information available through internet, and inquiry points.
As has already been noticed in Pakistan Entrepreneurship Ecosystem Report 2016, Pakistan’s growing foray into information space has been extremely healthy for its business culture, this ETI scorecard confirms it.